impacts
at unacademy
cohesive ai - attracting 1m registered users within just 5 months of launch. the monthly recurring revenue reached $30,000 with over 1000 paid users. additionally, a design system was created for more than 500 seo pages, enhancing the digital presence and user experience.
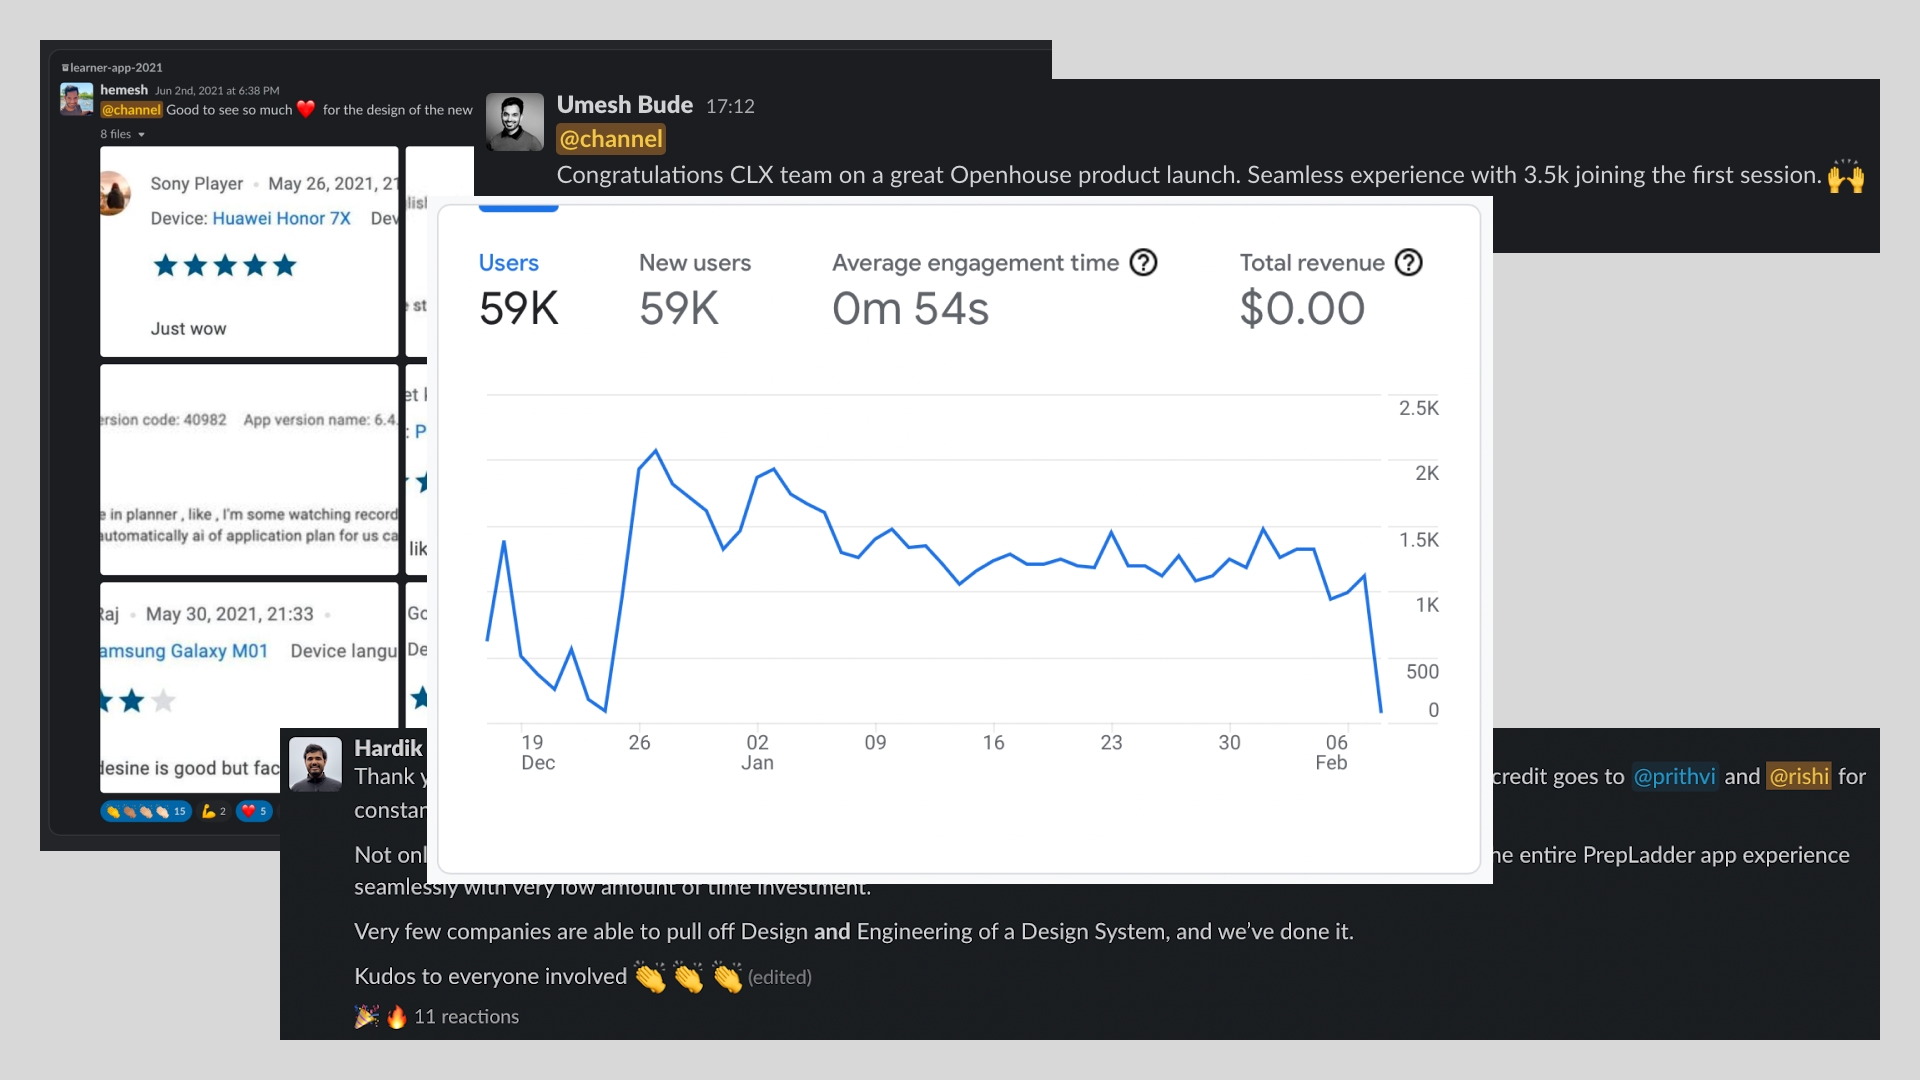
clx redesign - received a 98% positive experience rating, demonstrating its impact and user satisfaction. the etx redesign followed suit with a stellar 4.5 out of 5 experience rating.
combat - saw an impressive 100k sign-ups in the first month and has since reached 200k cumulative users attending unacademy combat, with an average nps of 4.5.
ask a doubt - achieved remarkable success, resolving over 2600 doubts in the first four weeks alone. now, it boasts a solution repository of more than 1 million solutions, becoming one of the most utilized features, especially across major revenue-generating goals.
a/b experiments - a game changer, with 14 experiments yielding significant results and being pushed to production. while 8 experiments didn’t show notable impact, 4 were comprehensive feature tests including combo, referral, renewal, and login signup.
live quiz - a hit too, averaging 3000 live quizzes per day with over 1 lakh learners participating. automated quizzes were scheduled to boost engagement on the app.
phoenix - reached about 144,000+ monthly active users, indicating its growing popularity.
prodigy - over 20k learners registering within 48 hours of the unacademy prodigy website launch.
seo - paid off with 2000+ pages auto-generated across goals, enhancing our digital footprint.
notes - usage soared with over 200k pdf notes viewed in the last 60 days, indicating high engagement with the content.
syllabus - adoption has been noteworthy. for the new syllabus (iit jee), it stood at 24%, while the old syllabus (neet ug) was at 5%. class adoption within the syllabus was higher, with iit jee at 44% and neet ug at 36%. notably, out of 260 unique iit jee users who started practice on the web, 78 did so through the syllabus section, amounting to 30%.
clx notebook - saw an adoption rate of 14% on the app and 8.59% on the web.
clx doubts - had 230k doubts posed by learners, with 111k of those doubts answered by educators, reflecting the feature’s effectiveness and reach.
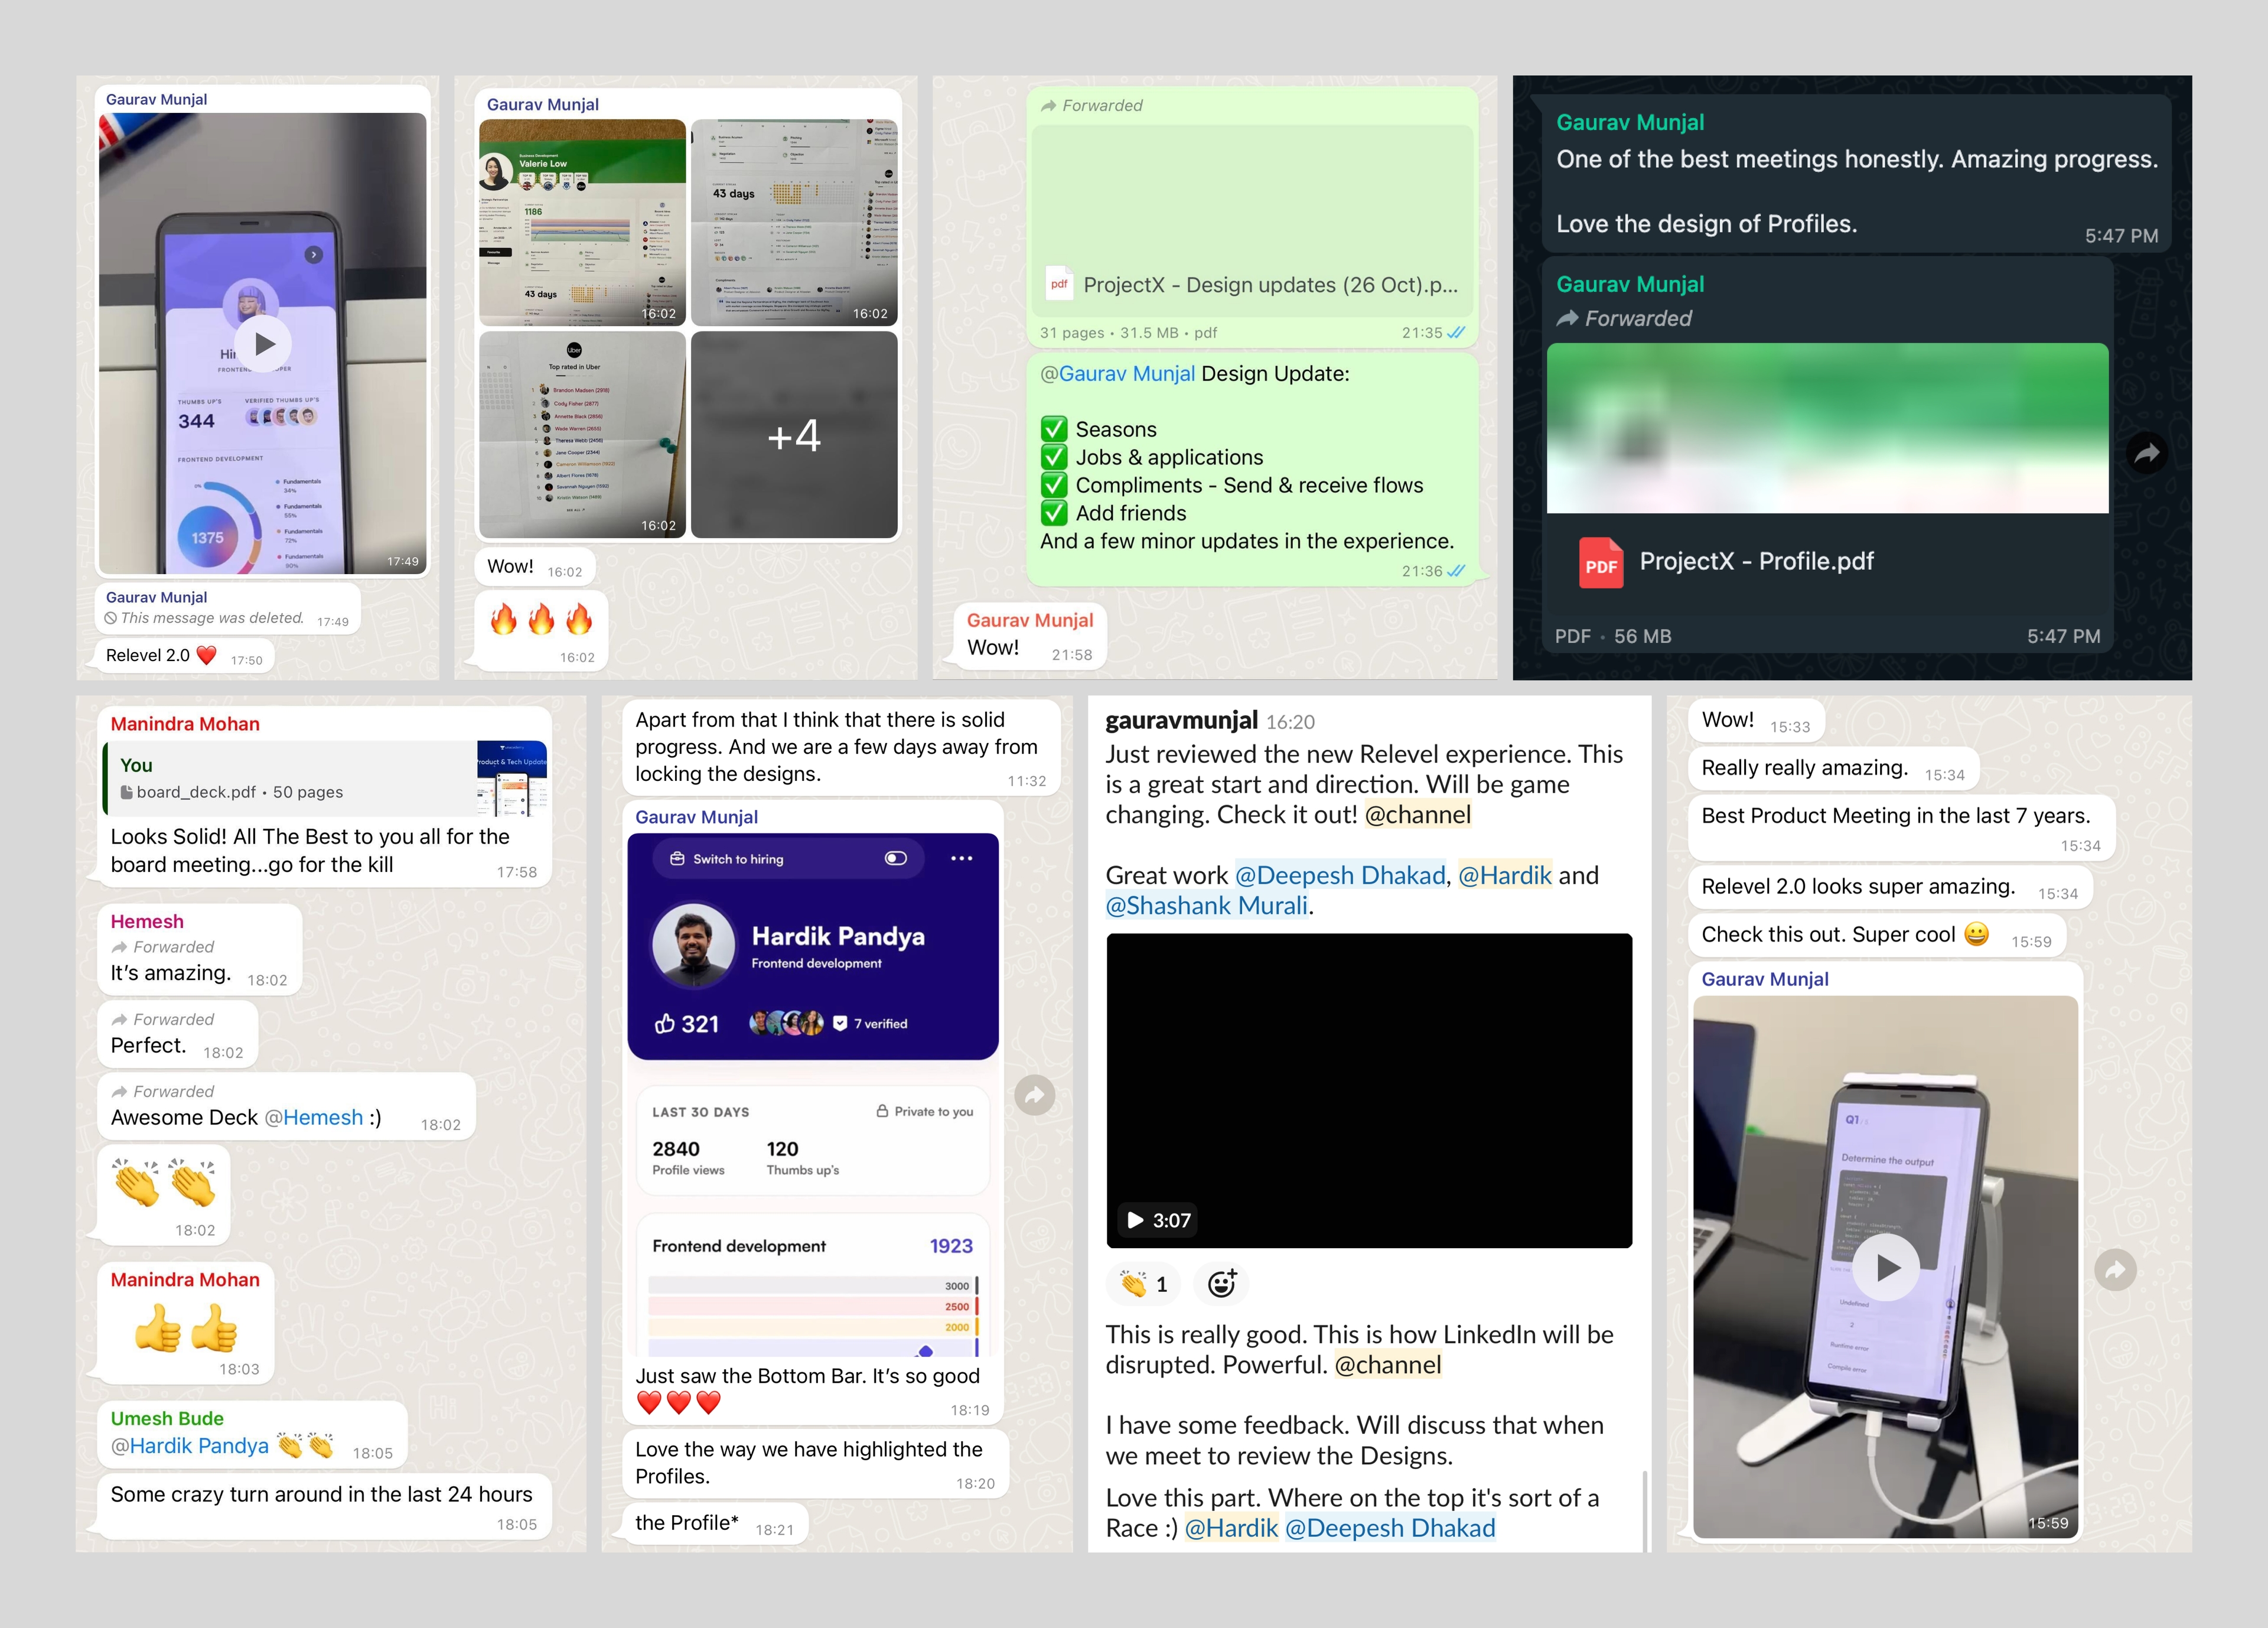
nextlevel - the positive feedback we received from our stakeholders was encouraging, motivating us to continue pushing forward, building more and enhancing our offerings. this support played a key role in driving our efforts to innovate and improve continuously.
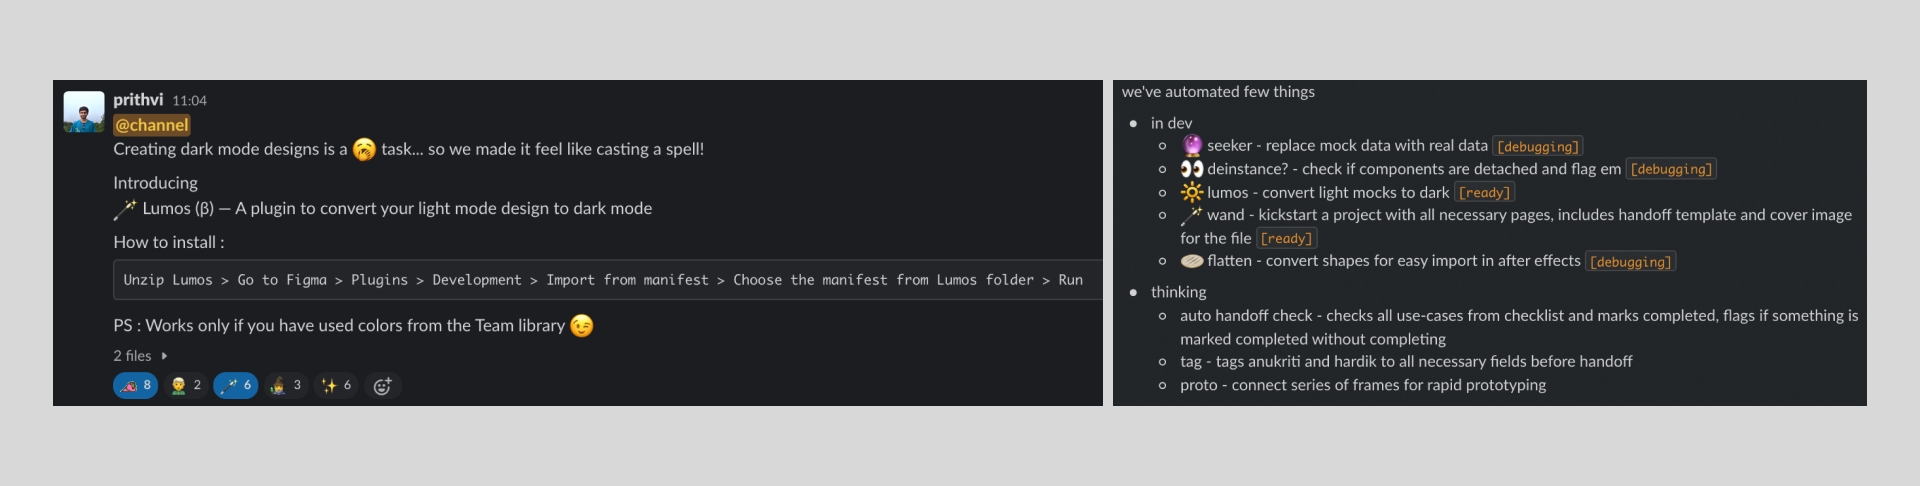
automations - developed a series of automations to enhance and expedite our design process, streamlining workflow and boosting efficiency.
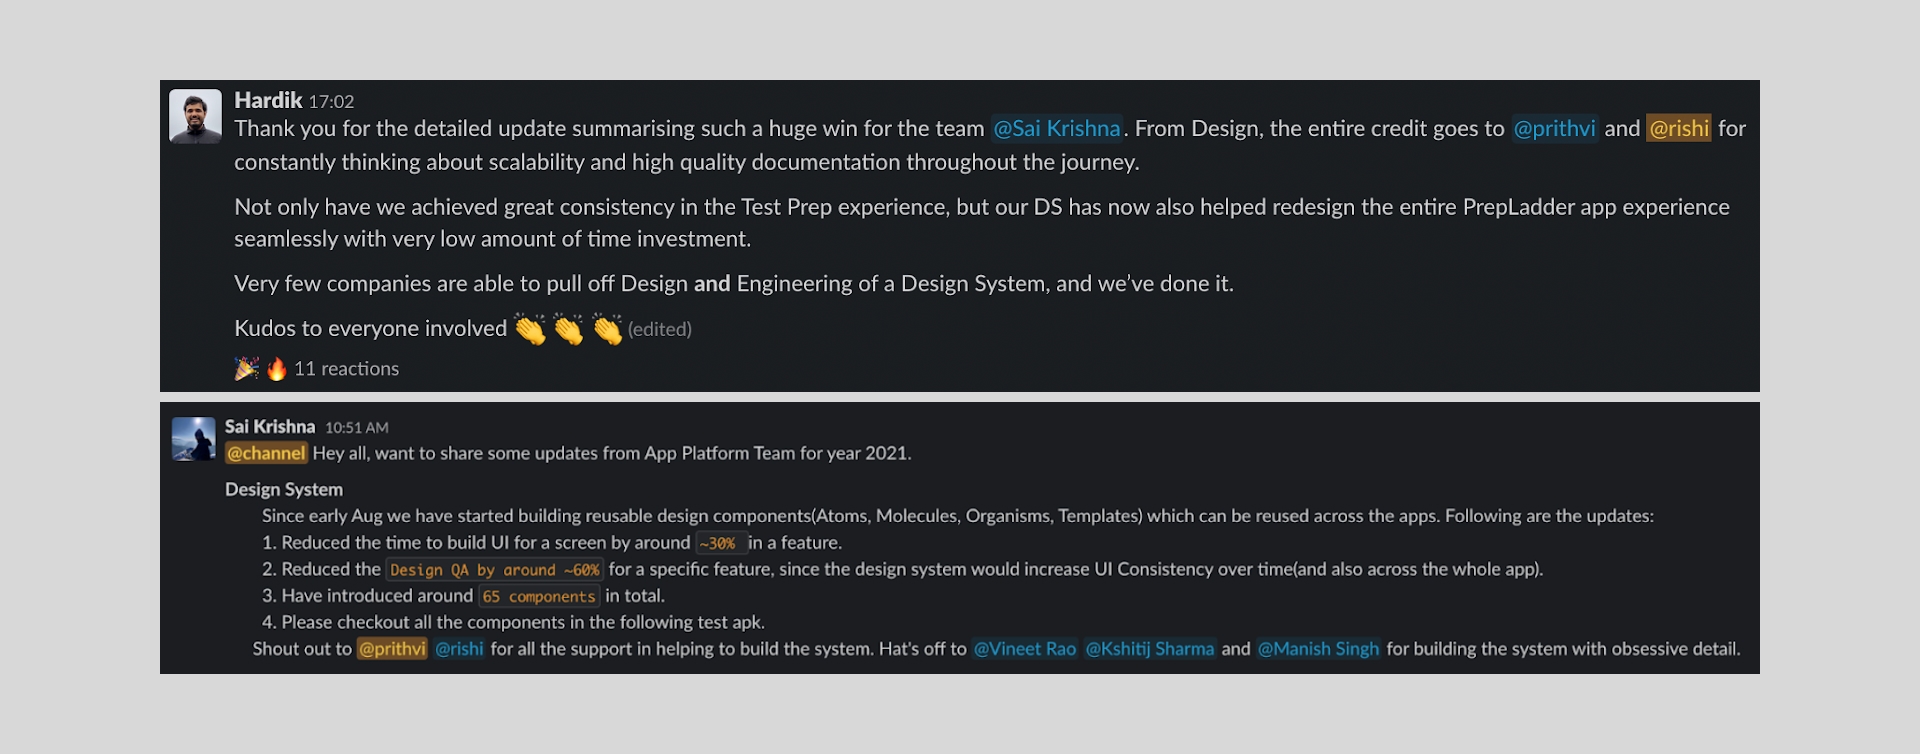
app foundations - development build time was reduced by around 30%, design quality assurance time saw a 60% decrease, and over 1000 new components were introduced.
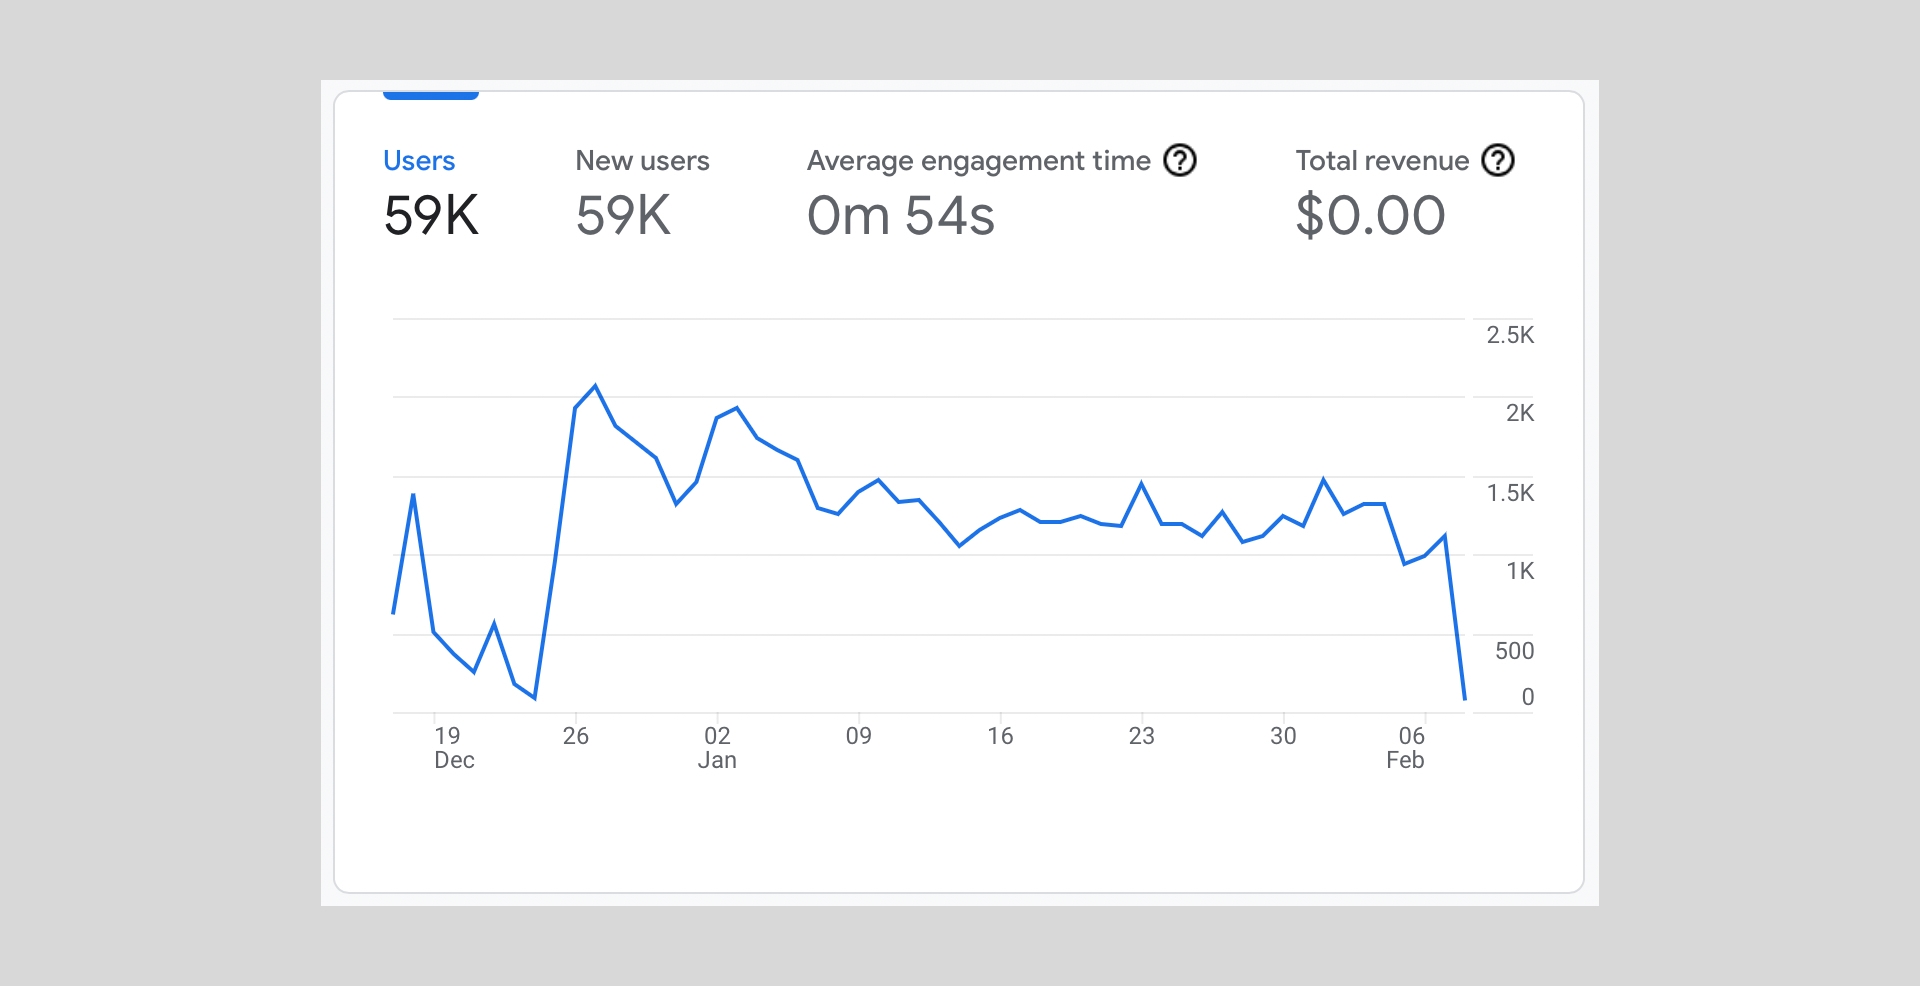
recap - 59k unique users visited the platform.
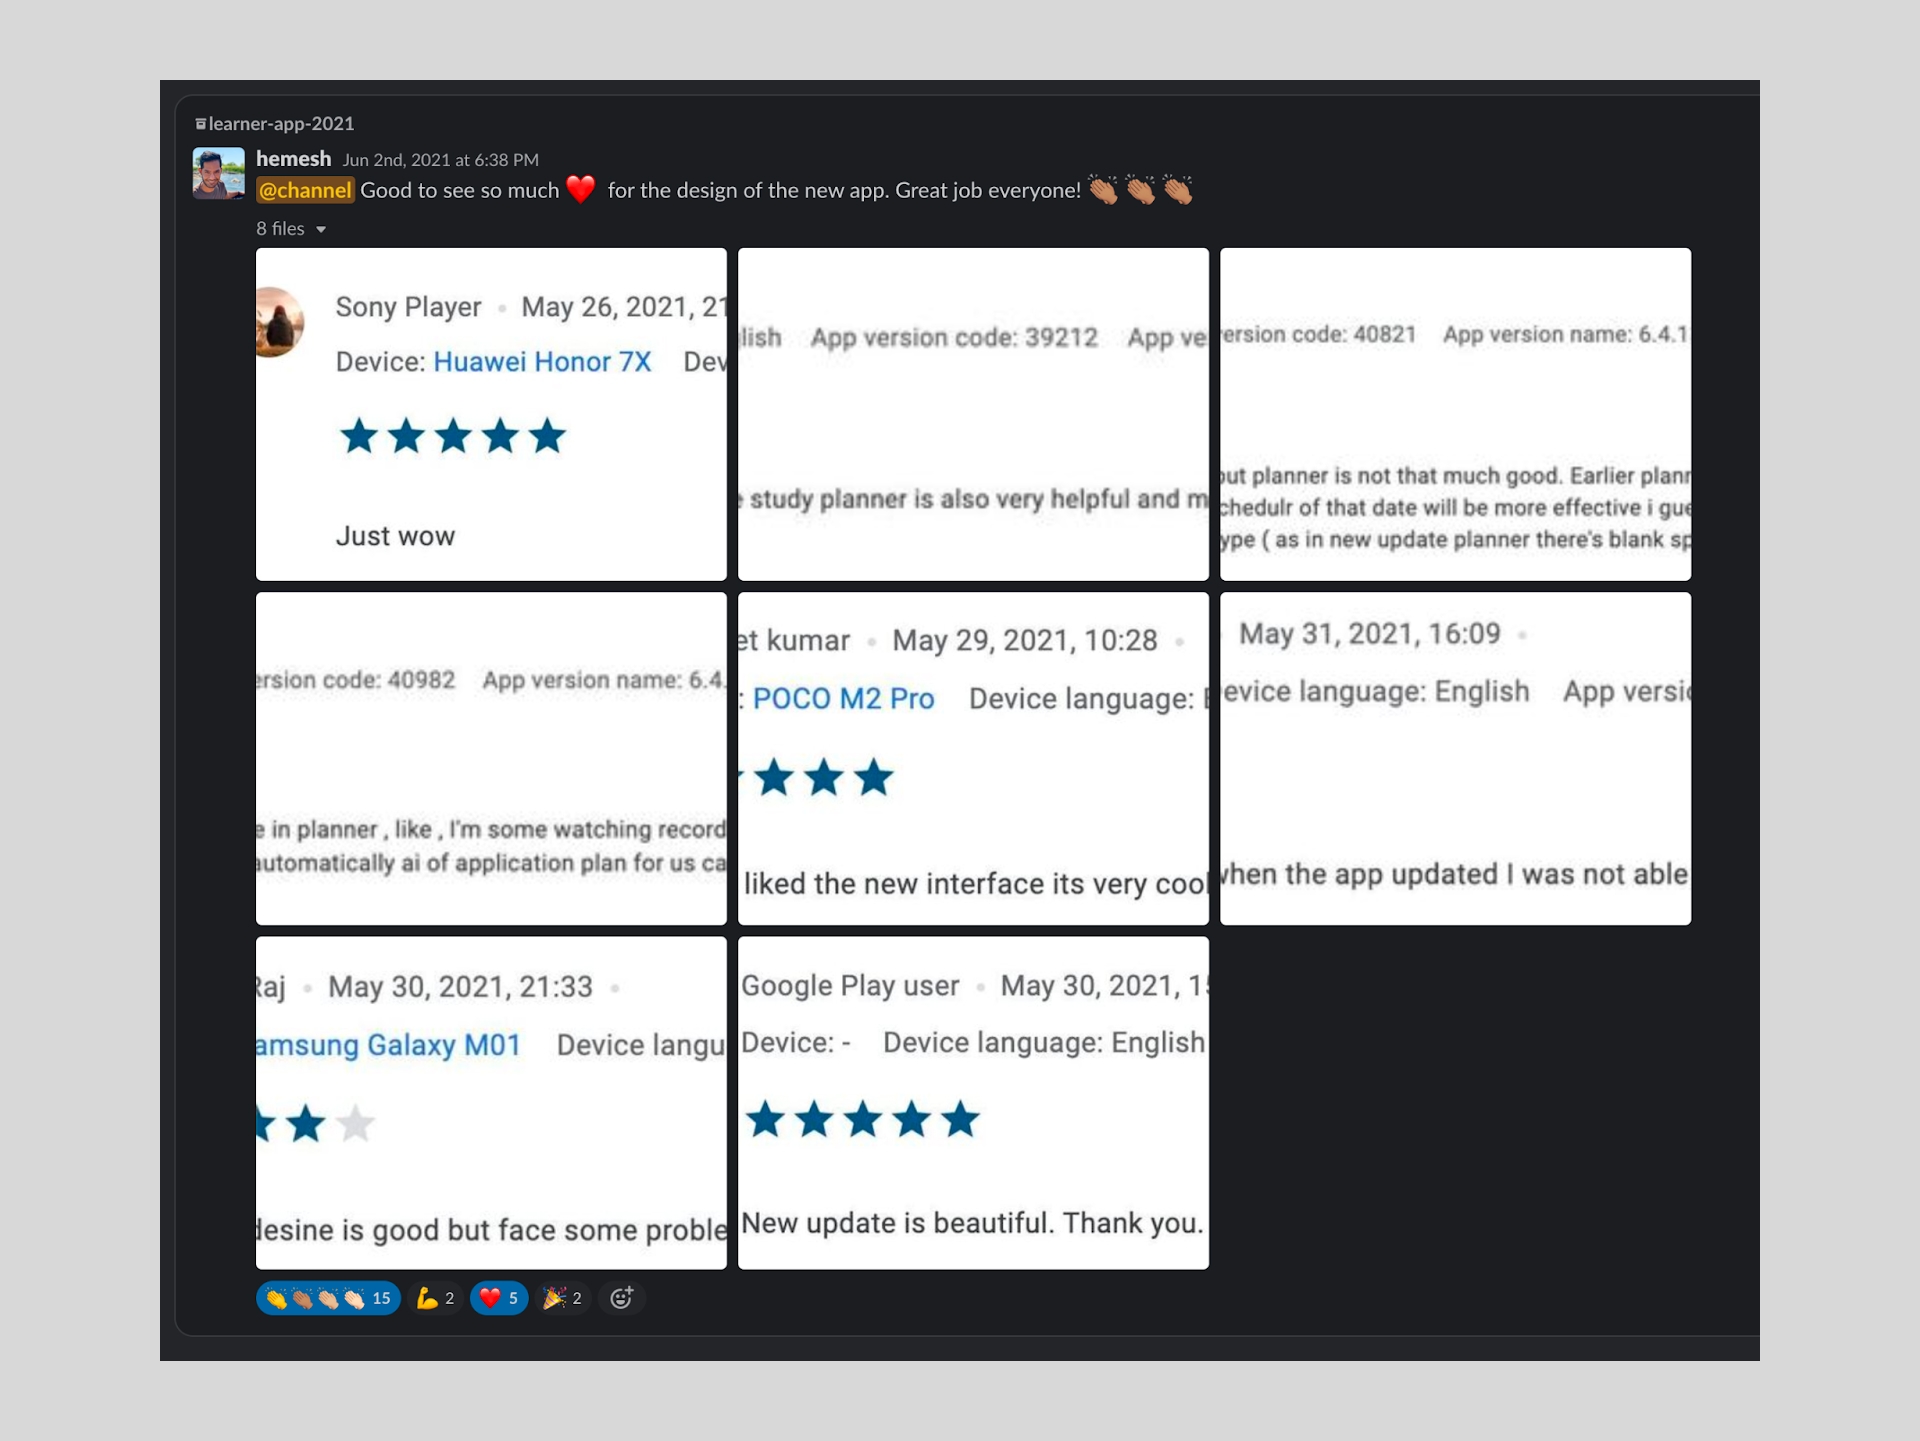
app redesign - post-launch, we saw a 90% positive experience rate, with the planner becoming the most used feature, learners favoring the new visual design, and groups notably increasing retention numbers, thanks to the addictive weekly competition.

openhouse - received 75% positive feedback and engaged 6.89k unique learners.

groups - 460k active learners participated, 204k groups were created, 406k reactions were used by learners, and 130k comments were posted, with most learners expressing a desire to change their groups for more competition.
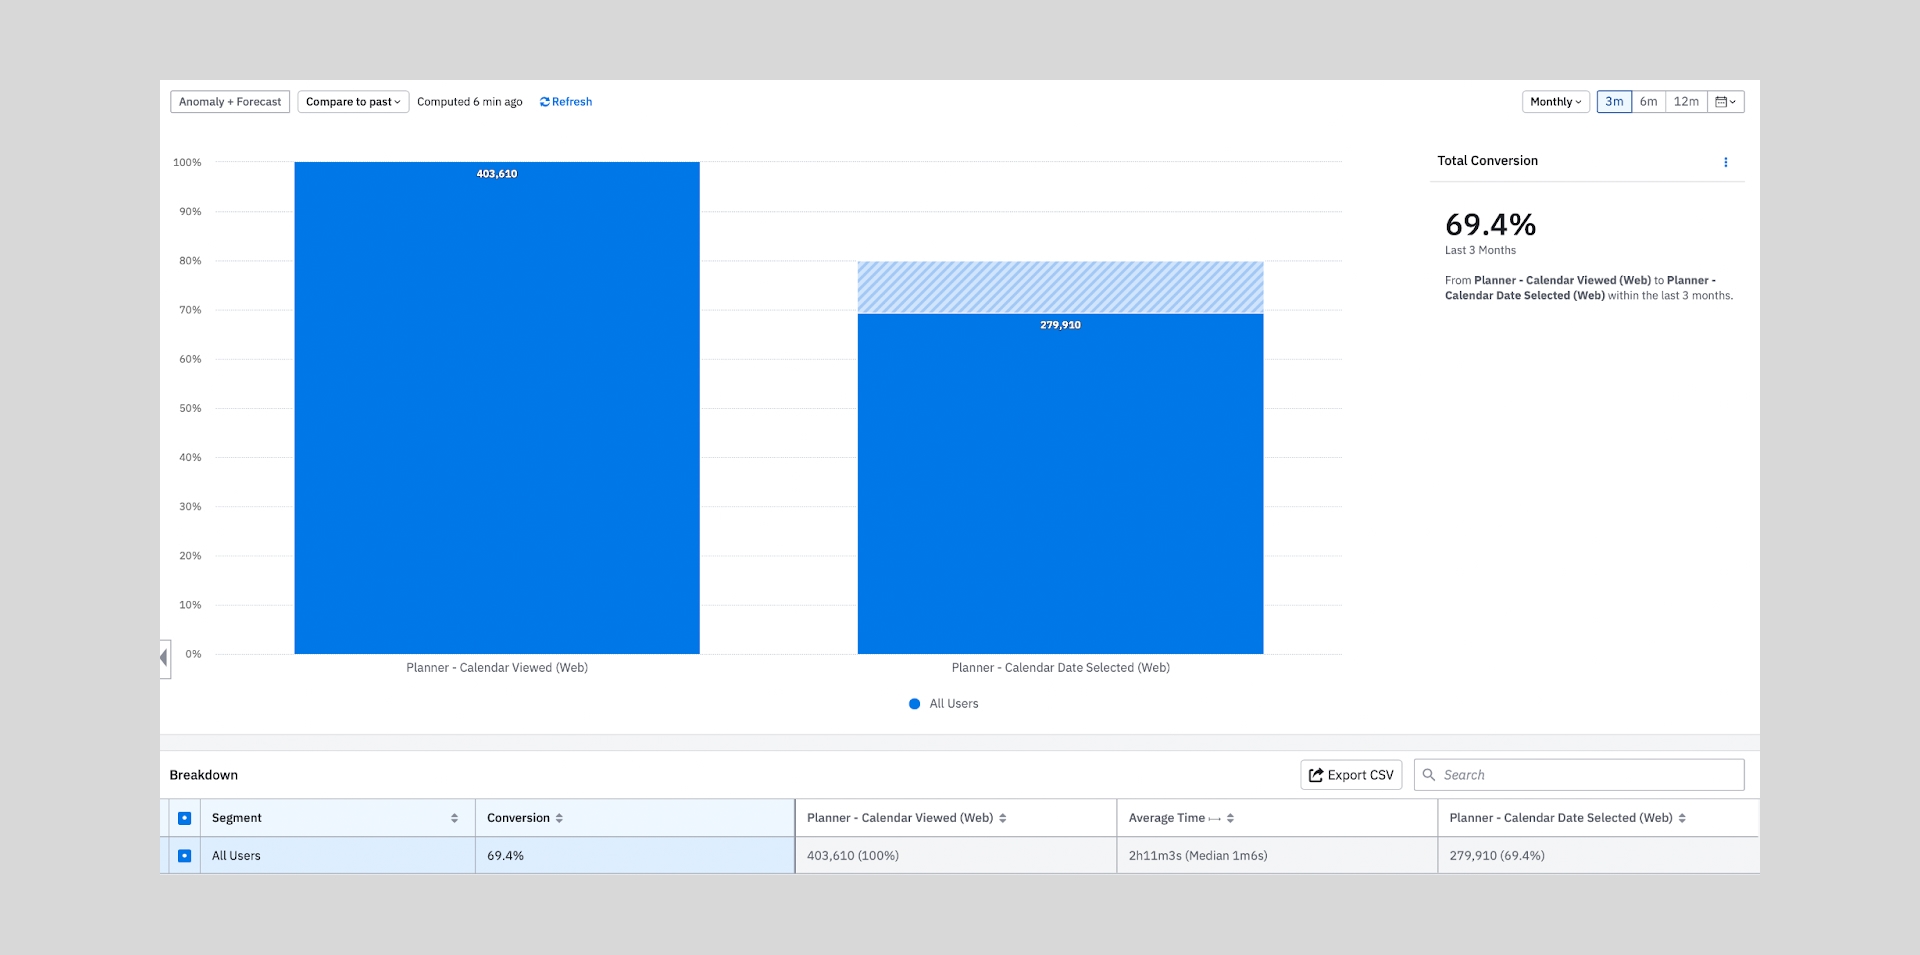
calendar on web - over 400k learners clicked on the calendar touchpoint, with 70% of them navigating to a different date.
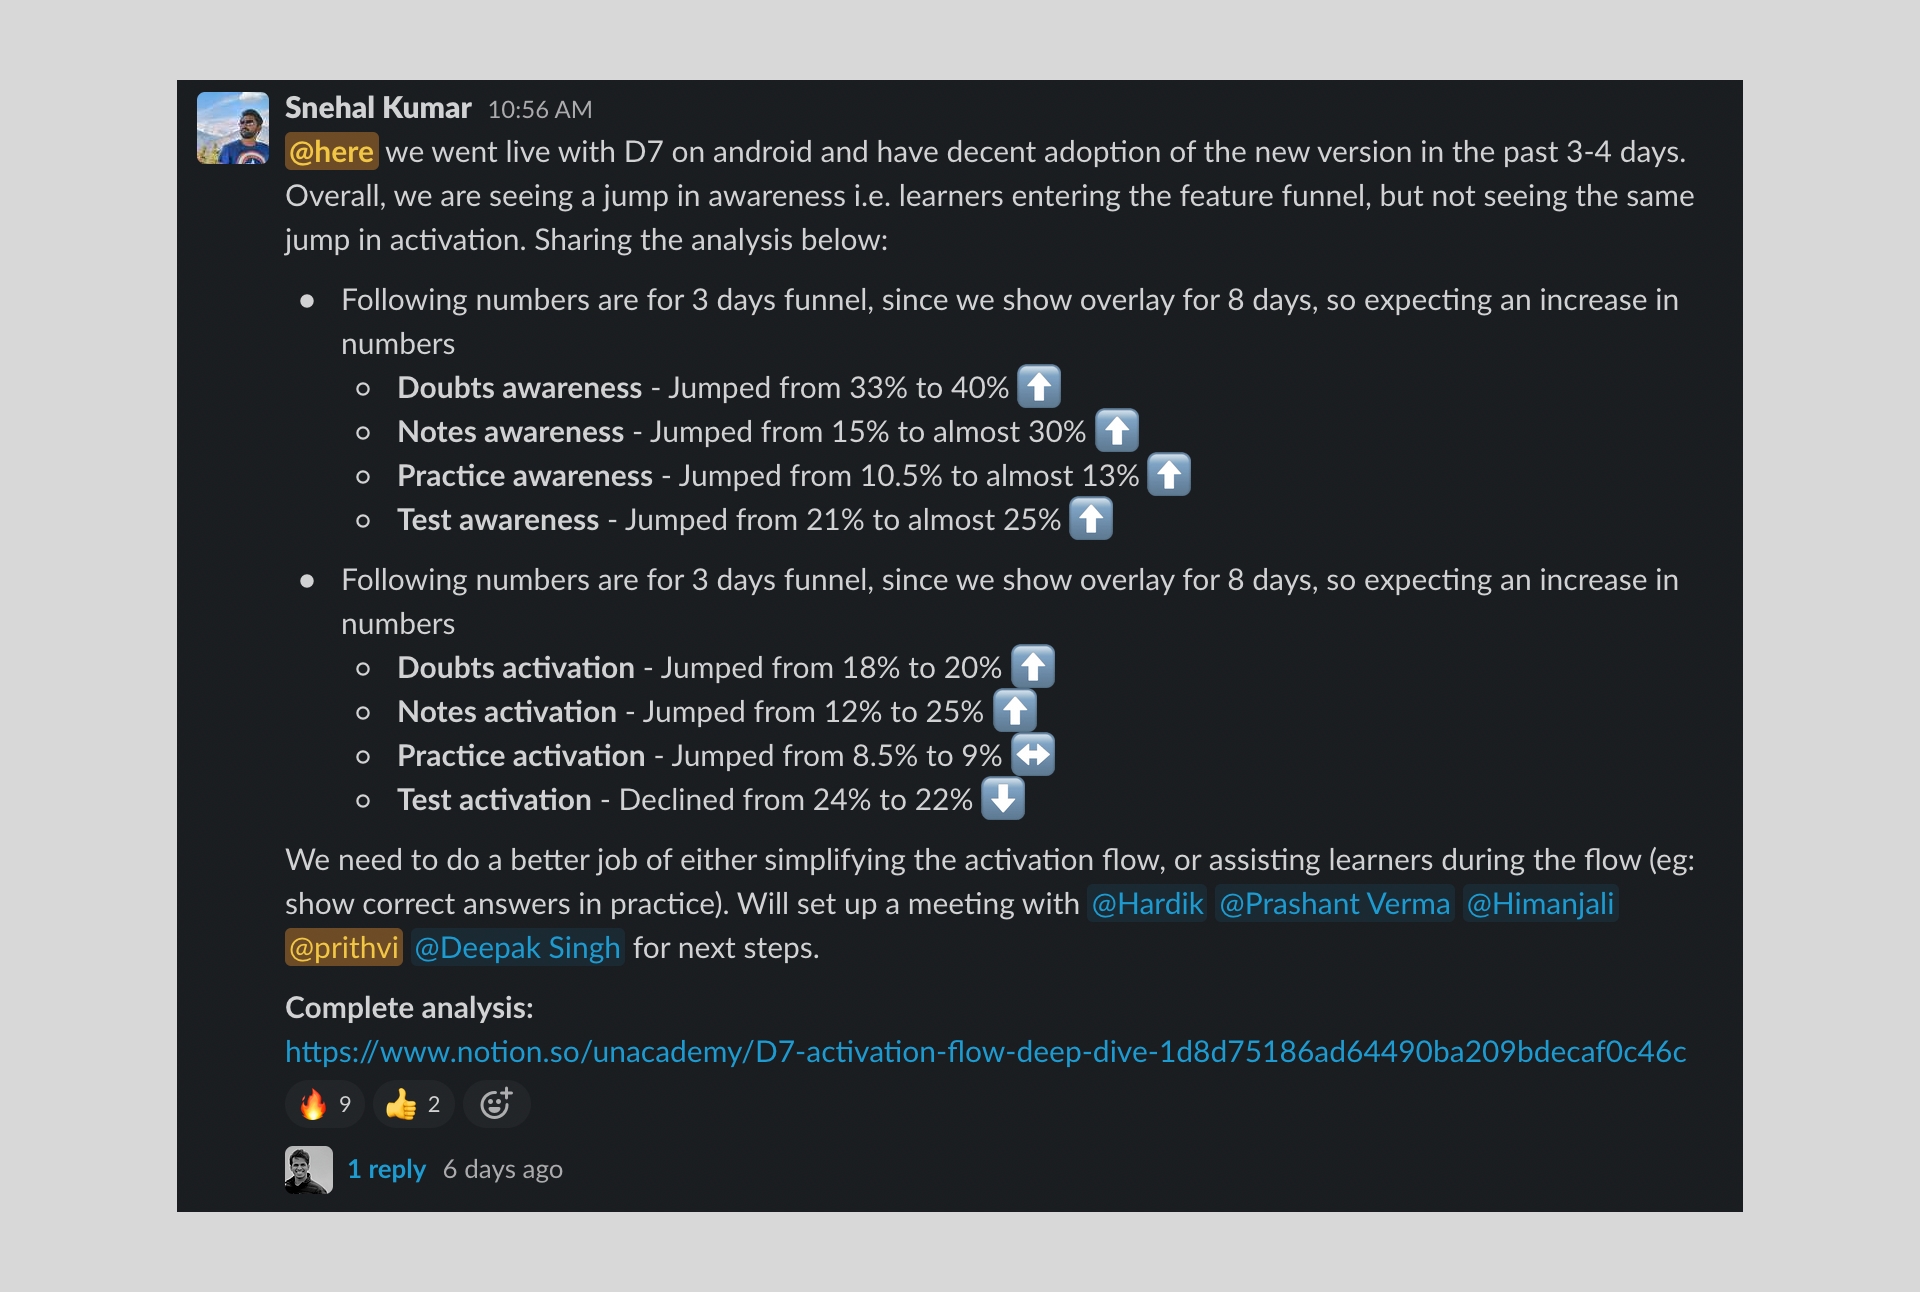
d7 - awareness of doubts, notes, practice, and tests significantly increased, jumping from 33% to 40%, 15% to nearly 30%, 10.5% to almost 13%, and 21% to nearly 25% respectively, while activation of doubts and notes also rose, from 18% to 20% and 12% to 25%.
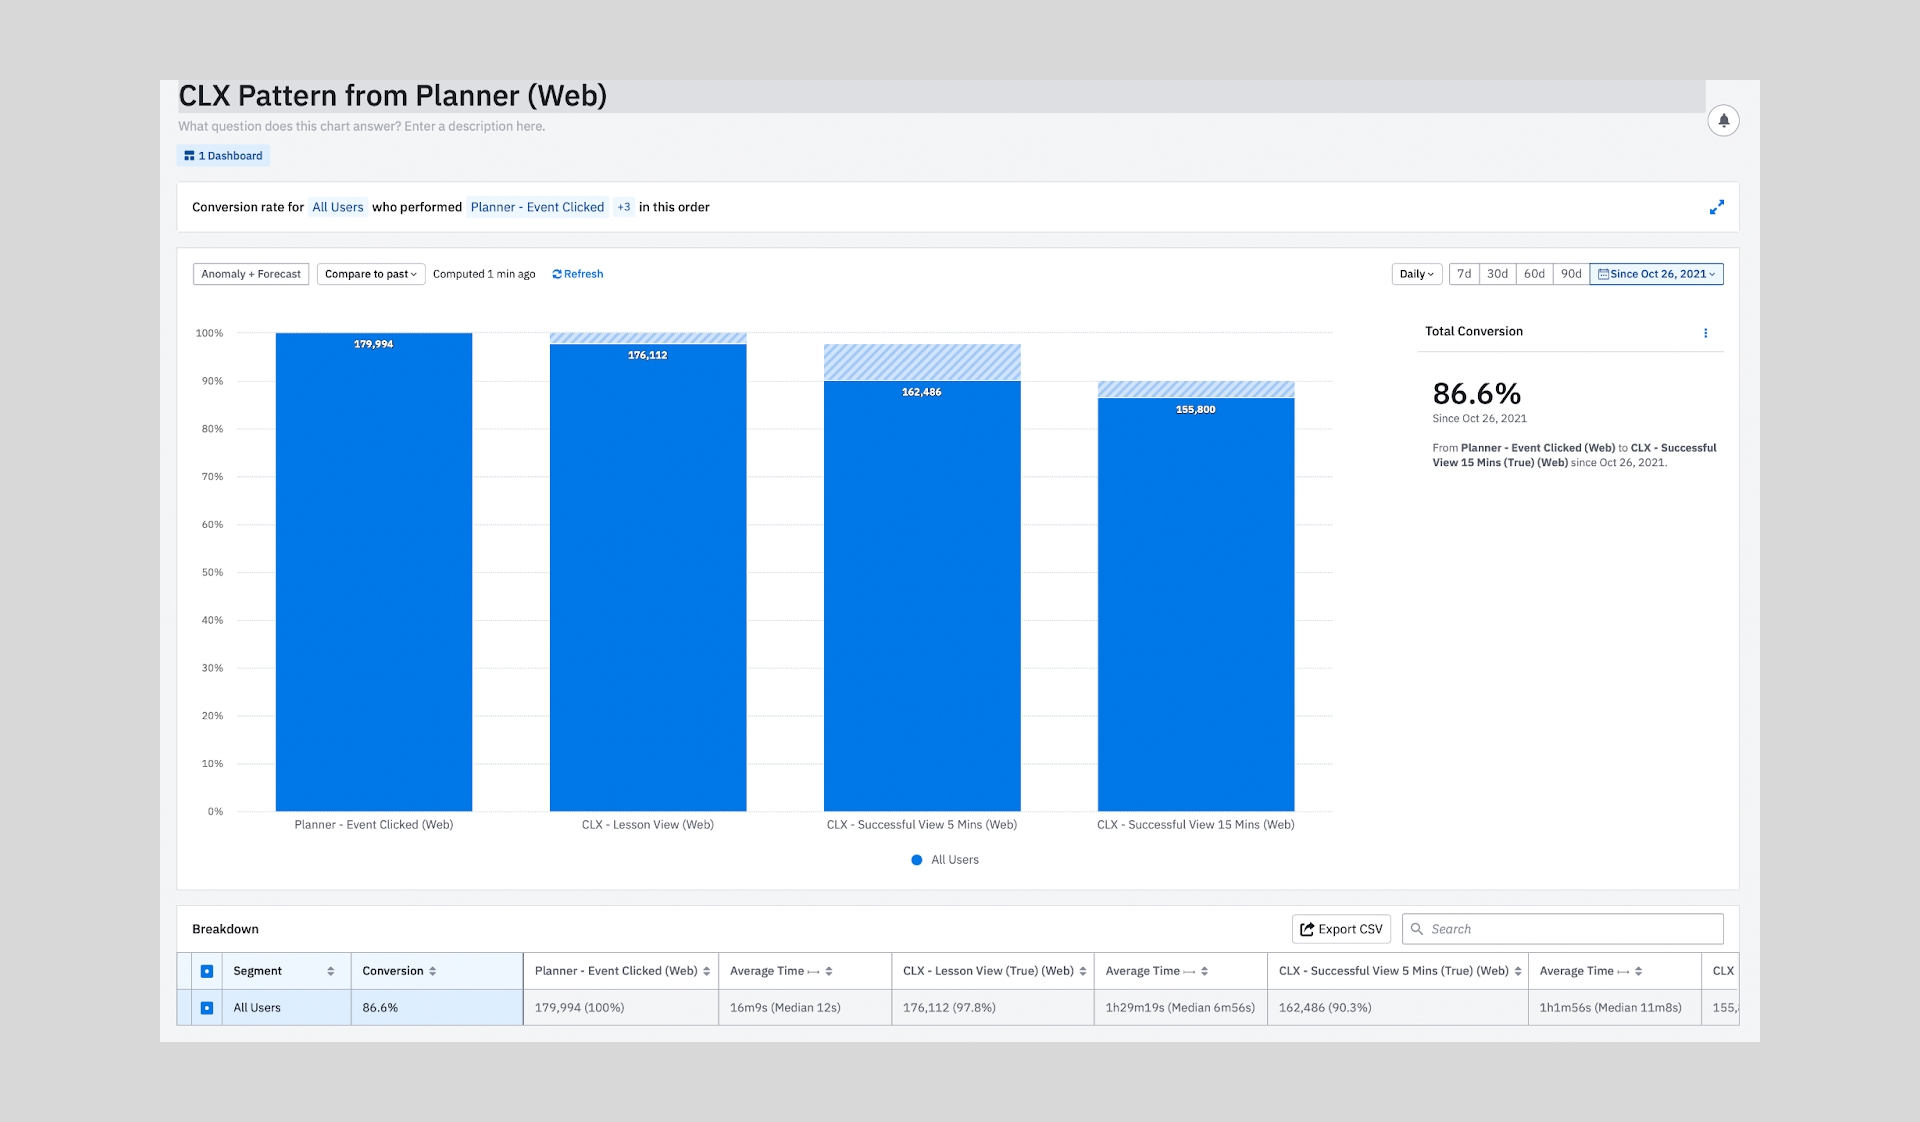
planner on web - week-on-week adoption of the planner on the web is at 39%, discovery of first-party features was improved with awareness cards, and 86% of learners watch classes from the planner.
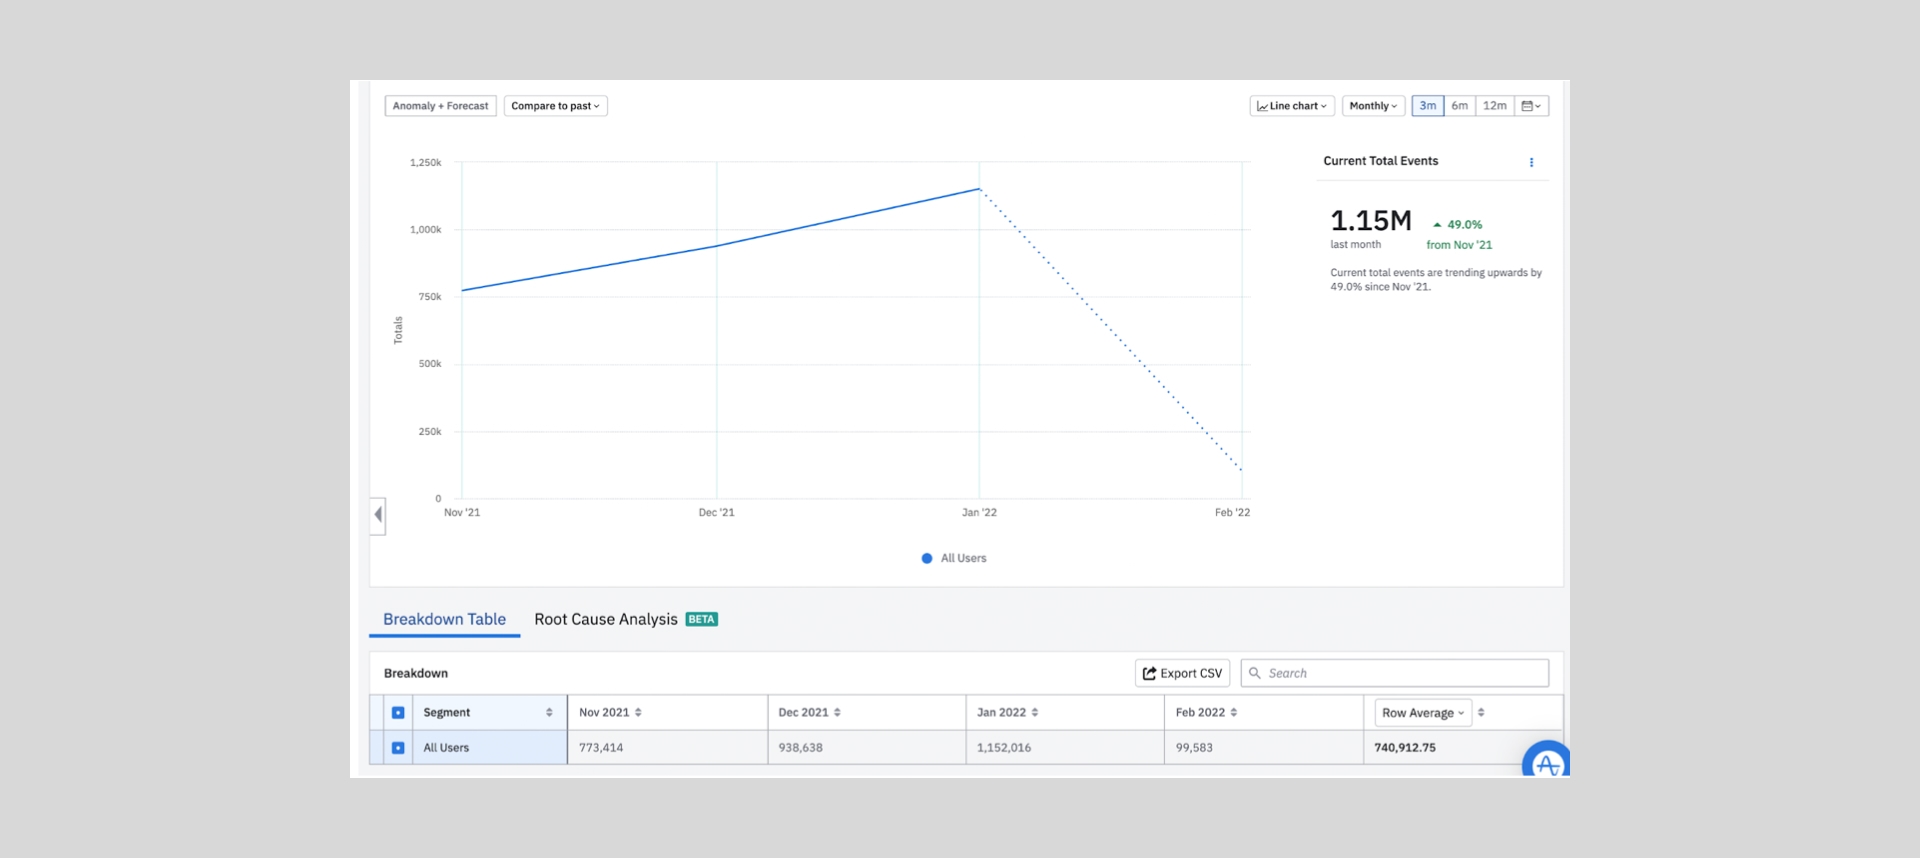
streak - post-launch, there was a 49% increase in the number of learners viewing their streak activity.
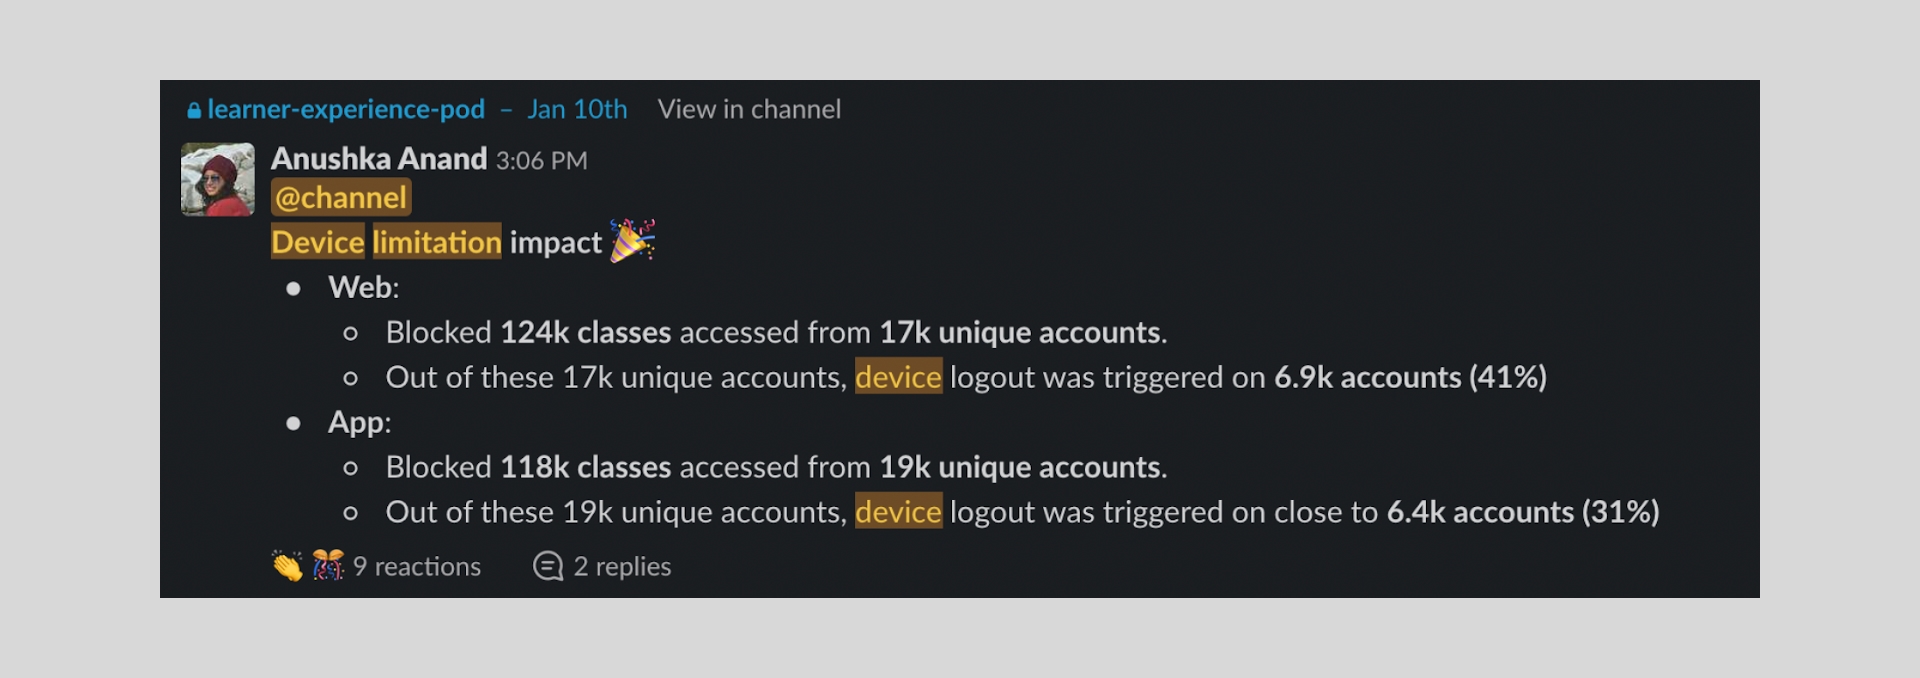
device limitation - 53.5% of learners opted to log out the other device when prompted.
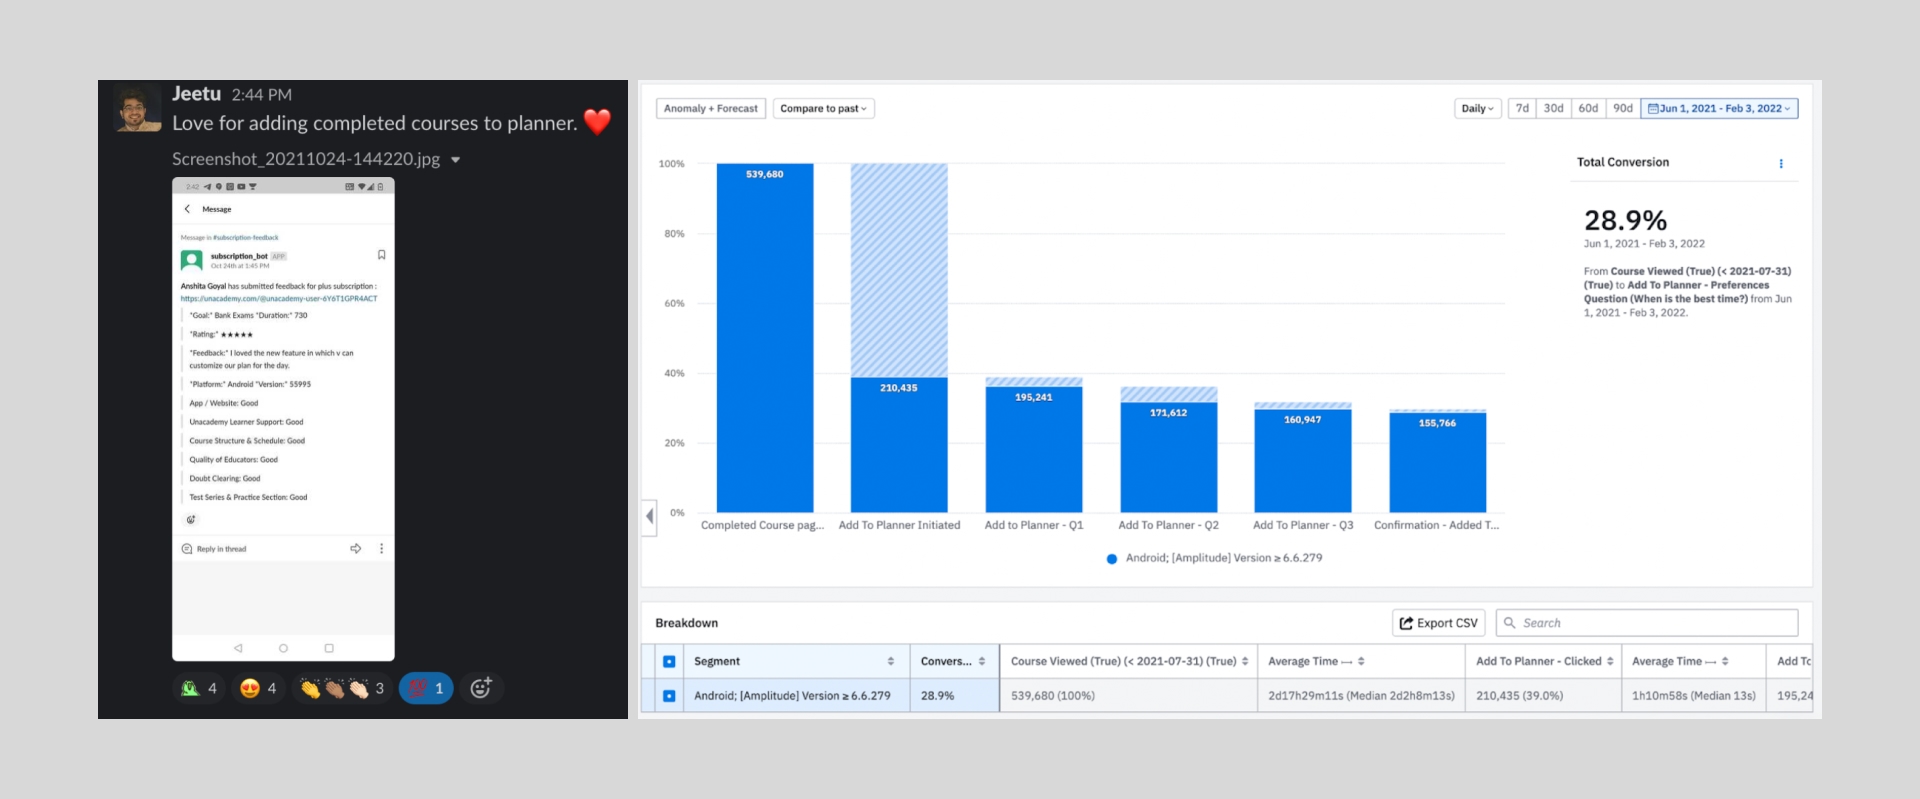
add to planner - over 200k learners clicked on 'add to planner', with the adoption rate standing at approximately 29%.